Mobile Apps - Piping
- User Management
- SET DEFAULT PROJECT
- TAKE OFFLINE DATA
- MILL CERTIFICATES
- TEST EQUIPMENT
- MIR
- RFI FITUP INSPECTION
- RFI WELD INSPECTION
- SPOOL RELEASE
- SHOW ALL PENDING REPORTS
- HYDRO PRESSURE
- NDT REPORTS
User Management
1.1 Downloading cuteQM app
To use the cuteQM app you must first download it from the Play Store.
- Open the Play Store and search for “cuteQM”.
- Download and install the cuteQMapp on your mobile phone.
- After installation, open the cuteQM
You are ready to go!
1.2 Log in
After installation, when you open the cuteQM app you may be asked to Login. Follow the steps to successfully log into your account.
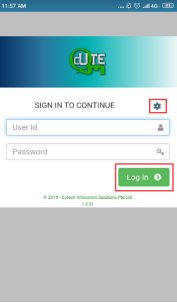

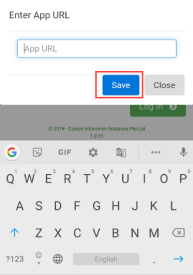
1. Before enter your user id and password, tap  (Settings icon) and enter the app URL that is provided by your administrator.
2. Tap Save.
3. Enter your user id and password in the allocated fields.
4. Tap Log in to complete the process.
The home screen of the cuteQM app is appeared.
1.3 Home screen of cuteQM app
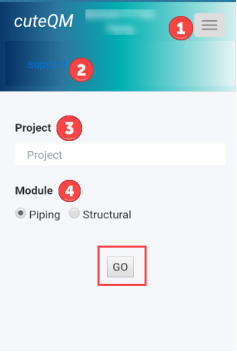
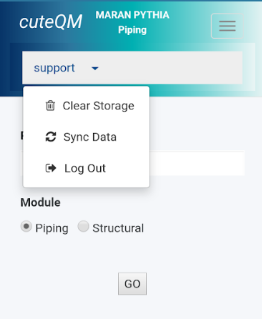
Figure 2.2 Home screen of cuteQM app
 -
-  (show/hide icon) helps to show/hide the user id information that is displayed in the left pane of the home screen. if you touch this icon the information appears on, if you touch this icon again the information goes off.
 - provided with a down arrow. If you click the down arrow, a list opens with three options such as Clear Storage, Sync Data, and Log out.
- Clear Storage - clears all data in this app. Tap the Clear Storageoption to delete all the data.
- Sync Data- synchronizes your inspection results with the respective reports in the web application. If your inspection results are not automatically synchronized with the web application, tap the Sync Data option for manual synchronization.
- Log out - See "Log out" section for details about log out of the app.
 Project – helps to select the project. To select the project,
- Tap the Project box, and select the project from a drop-down list.
 Module – helps to select the module. To select the module,
- Select Piping under the Module
- Tap GO.
A dashboard of the app is appeared.
 Note: The dashboard does not display MILL CERTIFICATES and TEST EQUIPMENT tabs unless your administrator adds your role in the cuteQM_Certificate Access option in the web application.
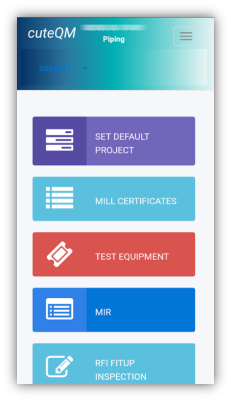
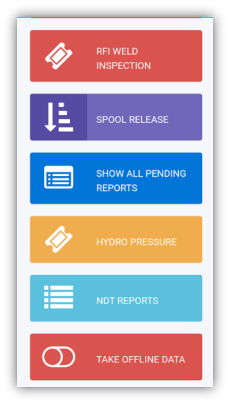
Figure 2.3 Dashboard of cuteQM app
1.4 Log out
Log out of your user's account from this Log out option. This command ends your current session of the app work.
- Tap the Log out option for logging out of the app. This will lead you back to the Log in Screen. See Fig 2.2.
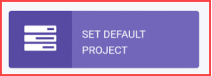
SET DEFAULT PROJECT
2.0 SET DEFAULT PROJECT
The SET DEFAULT PROJECT tab helps you to select or change the project and module.
To select or change the project and module,
 Note: if you are signing in to the app after the first-time login process, the app automatically redirects you into the dashboard page.
- Tap SET DEFAULT PROJECT. See Fig 2.3. The SET DEFAULT PROJECT page opens.
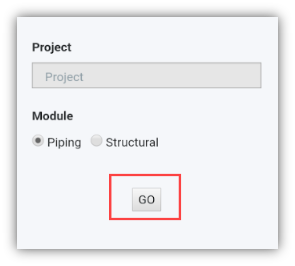
- Tap the Project box, and select the project from a drop-down list.
- Select the module you want, under the Module
- Tap GO.
TAKE OFFLINE DATA
3.0 TAKE OFFLINE DATA
The TAKE OFFLINE DATA tab helps you viewing the reports for the specific inspection dates you want.

When you select the respective dashboard tab you can view a list of reports corresponding to today and previous day. However, if you want to view the reports other than today and previous day, you must navigate to the TAKE OFFLINE DATA tab.
Do the following steps to view the reports using the TAKE OFFLINE DATA tab,
- Tap TAKE OFFLINE DATA. See Fig 2.3.
A new window opens for selecting category and date you want.
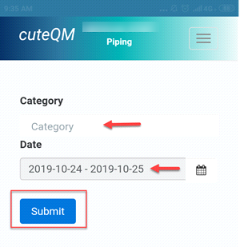
- In the Categorybox, tap and select the option you want to view the reports from a drop-down list.
- In the Date box, choosethe period of inspection by selecting respective dates.
 Tip: If you want to choose the period of inspection for more than one day, you must select from and to dates, accordingly.
- Tap Submit.
A new page opens for the selected option in the Category box.
MILL CERTIFICATES
4.0 MILL CERTIFICATES
The MILL CERTIFICATES tab allows you to view the material certificates added in the web application. This feature works only in online mode.
To view the material certificates,
- Tap MILL CERTIFICATES. See Fig 2.3.
The Mill Certificates page opens.
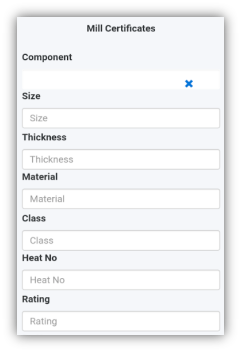
- Tap the Component box and select the component name from a drop-down list.
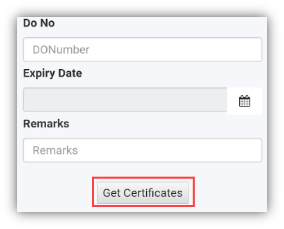
 Note: If you want to view the certificate for a specific component, enter the size, thickness, material name, class, heat number, rating, do number, expiry date or remarks of the component in the respective boxes.
- Tap Get Certificates. A list of material certificates for the selected component is appeared.
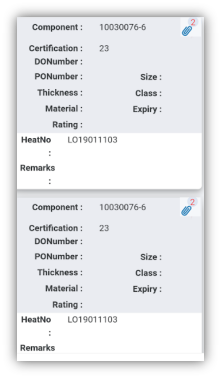
 Tip: If you want to view any attachment added with the material certificate, tap (Attach icon).
 Note: If the number of certificates exceeds 500, you will receive the following notification: “The result records are more than 500, so system can’t load, pls add another filter and search”.
TEST EQUIPMENT
5.0 TEST EQUIPMENT
The TEST EQUIPMENT tab helps you to get the details of the testing equipment that are added in the web application. This feature works only in online mode.
To get the test equipment details,
1. Tap TEST EQUIPMENT. See Fig 2.3.
The Testing Equipment page opens.
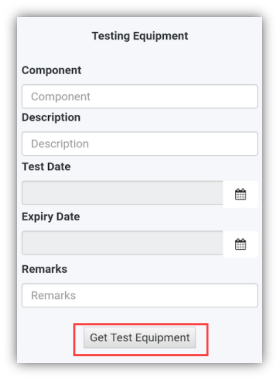
2. Enter the component name in the Component
 Note: If you want to get details for the specific test equipment, enter the description, test date, expiry date, or remarks of the equipment in the respective boxes.
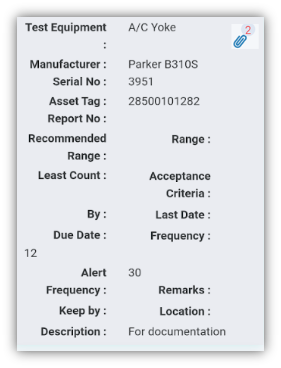
3. Tap Get Test Equipment. A list of test equipment reports for the selected component is appeared.
 Tip: If you want to view an attachment added with the test equipment, tap
  (Attach icon).
 Note: If the number of test equipment reports exceeds 500, you will receive the following notification: “The result records are more than 500, so system can’t load, pls add another filter and search”.
MIR
6.0 MIR
The MIR tab helps you to check and update a material verification report for the MIR requests, which are uploaded in the web application, by adding your inspection details. This MIR feature automatically updates and synchronizes your inspection details with the material verification report in the web application.
 Note: when you click the MIR tab in the dashboard, the MIR page displays a list of reports corresponding to today and previous day. However, if you want to view the reports for other dates, you must navigate to the TAKE OFFLINE DATA option. (See " TAKE OFFLINE DATA " for more details).
1. Tap MIR. See Fig 2.3.
The MIR page opens with a list of reports for the selected date.
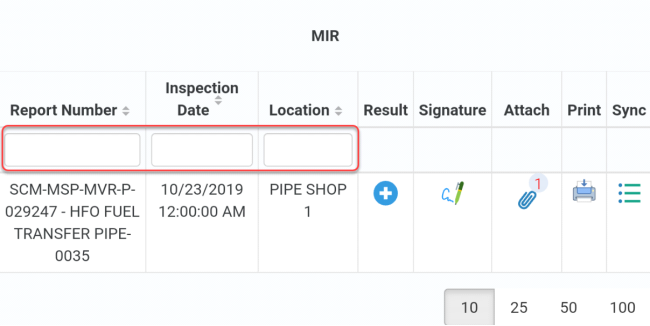
Figure 6.1 MIR page
 Tip: I. You can configure displaying of the number of reports per page by selecting 10, 25, 50 or 100, accordingly.
- If you want to filter one report among the list of reports, you must enter the report number, inspection date or location details in the respective boxes given in the MIR page.
The MIR page contains the following fields:
- Report Number– shows the request’s report number.
- Inspection Date– shows the date of inspection.
- Location– shows the location where the inspection to be performed.
- Result– you can add your inspection results.
- Signature– you can add your signature after completing the inspection.
- Attach – you can view any supporting document that is attached in the web application by tapping
 (Attach icon).

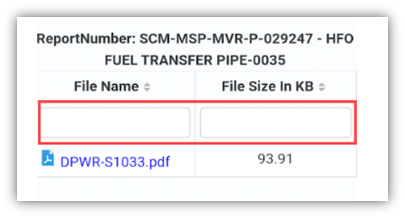
 Tip: You can filter the supporting document by using the File Name and File Size in KB options provided in the Attach page. See Fig given below.
- Print– you can download a copy of the report by tapping
 (Print icon).
 Tip: After adding your inspection details and signature into the MIR report, you can download a latest copy of the report by using the Print option to check whether your inspection details and signature are successfully updated with the report.
 - Sync – notifieswhether your inspection details are automatically synchronized with the web application or not. This Sync section initially shows the Sync icon like
 . Once you add your inspection details the Sync icon appears in
  .
.
After synchronization of your inspection details, the Sync section changes the Sync icon into
 .
. Tip: If your inspection details are not automatically synchronized, navigate to the manual synchronization option. (See “Sync Data “for more details.)


 .
.
To add your MIR inspection result
- Once you find out the report where you need to add your inspection details, tap
 (Result icon) to add your inspection results, See Fig 7.1.

The Result page opens with a list of reports with the material details. Each report shows material specifications such as description, specification, size, and type.
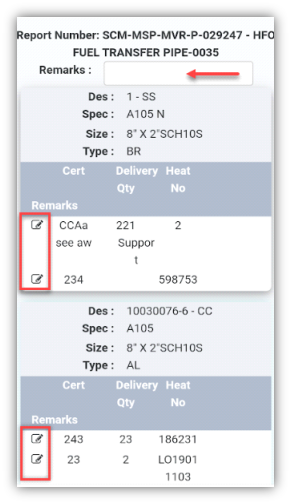
- In the Remarksbox, type your remarks if any.
- In Cert column,
 tap (Edit icon) for the report you want to add your result.

A new page for the selected report opens.
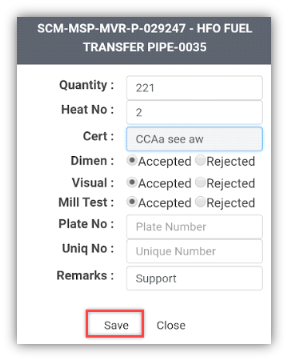
- Check and re-enter Quantity of the materials if you want.
- In Heat No box, enter the heat number.
- Checkthe certificate number in the Cert
- In Dimen, Visual, and Mill Testoptions, choose Accepted or Rejected based on your inspection details.
- In Plate Nobox, enter the plate number.
- In Uniq Nobox, enter the unique number.
- In the Remarksbox, type your remarks if any.
- Tap Save.
To add your signature
Once you have saved your inspection results, you must add your signature in the Signature field.
 Note: Make sure that you can add your signature if your role has assigned as QA, Subcontractor, Client or Owner, by the administrator.
- Tap
 (Signature icon), See Fig 7.1. The signature page opens.

 Note: If you are a login user, you can directly do sign for the respective role in the signature box, otherwise you must login with your user id and password before signing.
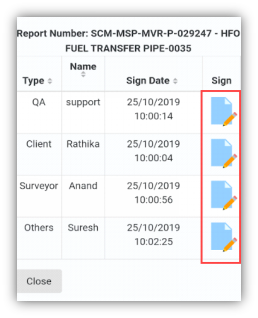
- Tap
 (Sign icon) provided in the right-side pane for the corresponding Type based on your role.

A new signature box opens.
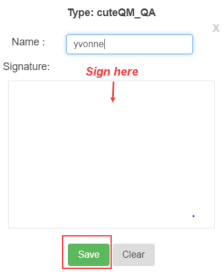
- In the Name box, enter your name.
 Note: If your role has assigned as QA, your name will be displayed automatically in the Name box. Other than QA, you must add your name before signing.
- In the Signature box, write your signature, and tap Save.
RFI FITUP INSPECTION
7.0 RFI FITUP INSPECTION
The RFI FITUP INSPECTION tab helps you to check and approve the RFI fitup request raised in the web application, by adding and updating your inspection details. This RFI fitup inspection feature automatically updates and synchronizes your inspection details with the RFI Fitup report that is uploaded in the web application.

 Note: when you click the RFI FITUP INSPECTION tab in the dashboard, the RFI Fitup Inspection page displays a list of reports corresponding to today and previous day. However, if you want to view the reports for other dates, you must navigate to the TAKE OFFLINE DATA option. (See " TAKE OFFLINE DATA" for more details.)
1. Tap RFI FITUP INSPECTION.See Fig 2.3.
The RFI Fitup Inspection page opens with a list of reports for the selected date.
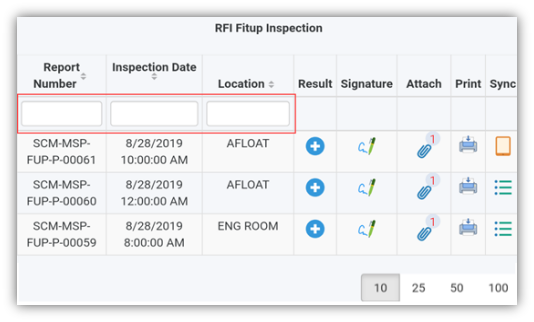
Figure 8.1 RFI Fitup Inspection page
 Tip: 1. You can configure displaying of the number of reports per page by selecting 10, 25, 50 or 100, accordingly.
2. If you want to filter one report among the list of reports, you must enter the report number, inspection date or location details in the respective boxes given in the RFI Fitup Inspectionpage.
The RFI Fitup Inspection page contains multiple fields such as Report Number, Inspection Date, Location, Result, Signature, Attach, Print, and Sync. (See the topic “The MIR page contains the following fields“ for more details about each field in the RFI Fitup Inspection page.)
To add your RFI fitup inspection result
1. Once you find out the report where you need to add your inspection details, tap  (Result icon) to add your inspection results, See Fig 8.1.
The Result page opens with a list of reports with the material details. Each report shows material specifications such as system details, line numbers, heat numbers, spool number, components name, MIR details, etc.
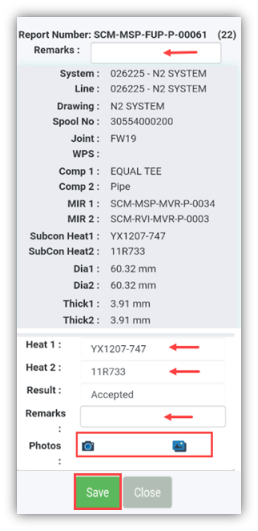
2. In the Remarksbox, type your remarks if any.
3. Check and reenter the heat numbers of the respective report where you want to add your inspection details.
4. In the Resultbox, tab and choose Pending, Accepted, Rejected or Cancelled from a drop-down list based on your inspection details.
5. In the Remarksbox, type your remarks if any.
6. If you want to add any photo with the report, do the following steps,
a. Tab  (photo capturing icon).
Your mobile camera starts to capture the image.
b. Capture the material part, which you want to add.
The captured images are automatically saved in the image’s gallery.
c. Tab (Images icon) to view the captured images.
 Note: The captured images are automatically updated with the web application.
- Tab Save.
To add your signature
Once you have saved your inspection results, the Result page automatically redirects you into the Signature page. Otherwise, tap
 (Signature icon), See Fig 8.1.
To know how to add your signature, see the topic “To add your signature“.
RFI WELD INSPECTION
8.0 RFI WELD INSPECTION
The RFI WELD INSPECTION tab allows you to check and approve the RFI weld visual request raised in the web application, by adding and updating your inspection details. This RFI weld inspection feature automatically updates and synchronizes your inspection details with the RFI weld report that is uploaded in the web application.
 Note: when you click the RFI WELD INSPECTION tab in the dashboard, the RFI Weld Inspection page displays a list of reports corresponding to today and previous day. However, if you want to view the reports for other dates, you must navigate to the TAKE OFFLINE DATA option. (See " TAKE OFFLINE DATA" for more details.)
1. Tap RFI WELD INSPECTION.See Fig 2.3.
The RFI Weld Inspection page opens with a list of reports for the selected date.
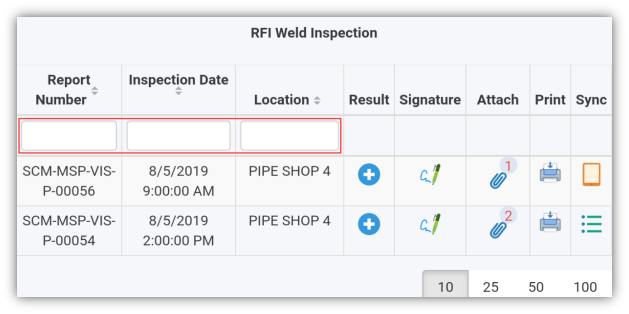
Figure 9.1 RFI Weld Inspection page
 Tip: 1. You can configure displaying of the number of reports per page by selecting 10, 25, 50 or 100, accordingly.
2. If you want to filter one report among the list of reports, you must enter the report number, inspection date or location details in the respective boxes given in the RFI Weld Inspectionpage.
The RFI Weld Inspection page contains multiple fields such as Report Number, Inspection Date, Location, Result, Signature, Attach, Print, and Sync. (See the topic “The MIR page contains the following fields“ for more details about each field in the RFI Weld Inspection page.)
To add your RFI weld inspection result
1. Once you find out the report where you need to add your inspection details, tap  (Result icon) to add your inspection results, See Fig 9.1.
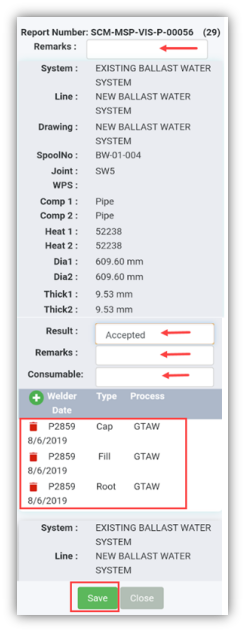
The Result page opens with a list of reports with the material details. Each report shows material specifications such as system name, line name, heat numbers, spool number, components name, joint number, etc.
2. In the Remarksbox, type your remarks if any. See Fig given below step 5.
3. In the Result box, tap and choose Pending, Accepted, Rejected or Cancelled from a drop-down list based on your inspection details.
4. In the Remarksbox, type your remarks if any.
5. In the Consumable box, enter the weld consumable name.
6. To add the welding details, tap  (welding details add icon). A new window opens.
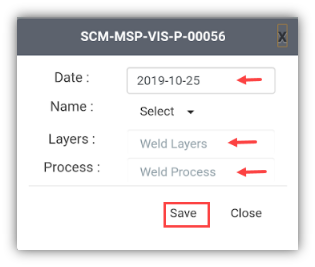
- In the Datebox, choose date.
- In the Namebox, tap and select your name from a drop-down list.
- In the Layers box,tap and select layers from a drop-down list.
- In the Process box, tap and select the weld process from a drop-down list.
- Tap Save.
7. If you want to delete any welder ID details from a list, tap  (delete icon).
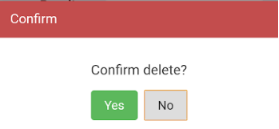
You will receive the following notification: “Confirm delete?”. If you want to delete tap Yes, otherwise tap No.
- Tab Save.
To add your signature
Once you have saved your inspection results, the Result page automatically redirects you into the Signature page. Otherwise, tap
 (Signature icon), See Fig 9.1.
To know how to add your signature, see the topic “To add your signature“.
SPOOL RELEASE
9.0 SPOOL RELEASE
The SPOOL RELEASE tab helps you to check and update the spools added in the web application, by adding your inspection details. This feature automatically updates and synchronizes your inspection details with the spool report that is uploaded in the web application.
 Note: when you click the SPOOL RELEASE tab in the dashboard, the Spool Release page displays a list of reports corresponding to today and previous day. However, if you want to view the reports for other dates, you must navigate to the TAKE OFFLINE DATA option. (See " TAKE OFFLINE DATA" for more details.)
1. Tap SPOOL RELEASE.See Fig 2.3. The Spool Release page opens with a list of reports for the selected date.
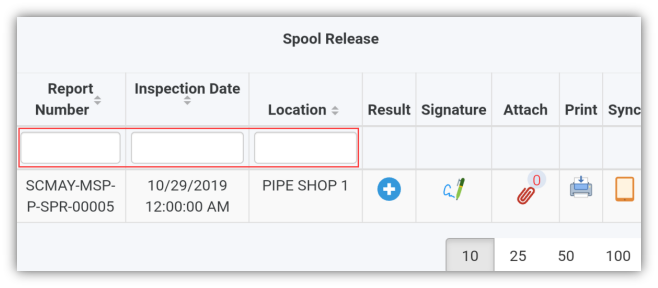
Figure 10.1 Spool Release page
 Tip: 1. You can configure displaying of the number of reports per page by selecting 10, 25, 50 or 100, accordingly.
2. If you want to filter one report among the list of reports, you must enter the report number, inspection date or location details in the respective boxes given in the Spool Releasepage.
The Spool Release page contains multiple fields such as Report Number, Inspection Date, Location, Result, Signature, Attach, Print, and Sync. (See the topic “The MIR page contains the following fields“ for more details about each field in the Spool Release page.)
To add your spool inspection result
1. Once you find out the report where you need to add your inspection details, tap  (Result icon) to add your inspection results, See Fig 10.1.
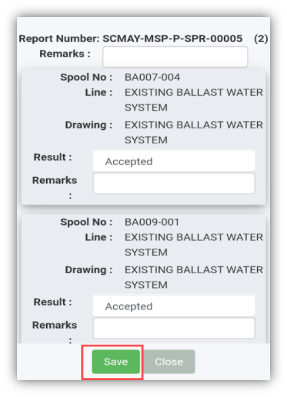
The Result page opens with a list of reports with the material details. Each report shows material specifications such as spool number, line number, and drawing number.
- In the Remarksbox, type your remarks if any.
- In the Resultbox, tap and choose Pending, Accepted, Rejected or Cancelled from a drop-down list based on your inspection details
- In the Remarksbox, type your remarks if any.
- Tap Save.
To add your signature
Once you have saved your inspection results, the Result page automatically redirects you into the Signature page. Otherwise, tap
 (Signature icon), See Fig 10.1.
To know how to add your signature, see the topic “To add your signature“.
SHOW ALL PENDING REPORTS
10.0 SHOW ALL PENDING REPORTS
The SHOW ALL PENDING REPORTS tab helps you to view all pending reports for the inspections those are not completed yet. By using this feature, you can check whether the QA, Sub contractor, Client, and Owner have submitted their inspection report.
This feature automatically updates the detail of all pending reports from the web application. You can view the pending reports in an offline mode also.
Do the following steps to view the pending reports,
1. Tap SHOW ALL PENDING REPORTS. The Pending Reports page opens.
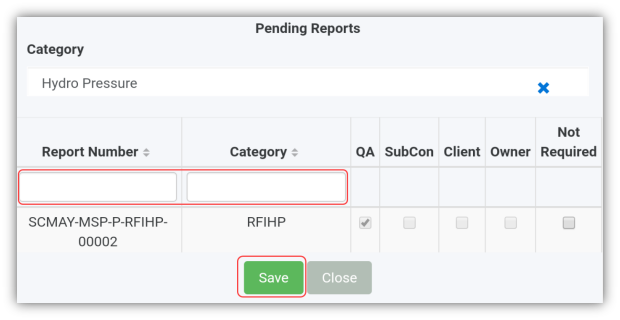
Figure 11.1 Pending Reports page
 Tip: 1. You can configure displaying of the number of reports per page by selecting 10, 25, 50 or 100, accordingly.
2. If you want to filter one report among the list of reports, you must enter the report number or category details in the respective boxes given in the Pending Reportspage.
The Pending Reports page contains the following fields:
- Report Number - shows the report number of the pending reports.
- Category - shows the category of the pending reports.
- QA, Subcon, Client, and Owner- each field appears with a check box to show whether the inspection has completed by the QA, Subcontractor, Client, and Owner, respectively.
 Note: If the check box of any field is enabled with the tick mark, it means that the respective person has completed the inspection.
- Not required - appears with a check box that helps you to decide about further inspection process. You can enable the check box if you have decided that no need of any further inspection process to be done by the QA, Subcontractor, Client or Owner.
- Tap the Category box, and select the category from a drop-down list.
The Pending Reports page shows a list of pending reports corresponding to the selected category. You can check the status of the report.
- If want to end up the inspection process, enable the check box in the Not required
- Tap Save.
HYDRO PRESSURE
11.0 HYDRO PRESSURE
The HYDRO PRESSURE tab helps you to update the status and result of the RFI hydro pressure request raised in the web application. You can add your hydro pressure inspection details by using this feature. This feature automatically updates and synchronizes your inspection details with the hydro pressure report of the request, which is uploaded in the web application.
 Note: when you click the HYDRO PRESSURE tab in the dashboard, the Hydro Pressure page displays a list of reports corresponding to today and previous day. However, if you want to view the reports for other dates, you must navigate to the TAKE OFFLINE DATA option. (See " TAKE OFFLINE DATA" for more details.)
1. Tap HYDRO PRESSURE. See Fig 2.3.
The Hydro Pressure page opens with a list of reports for the selected date.
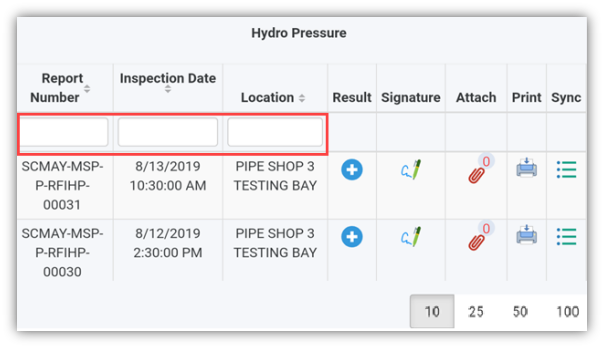
Figure 12.1 Hydro Pressure page
 Tip: 1. You can configure displaying of the number of reports per page by selecting 10, 25, 50 or 100, accordingly.
2. If you want to filter one report among the list of reports, you must enter the report number, inspection date or location details in the respective boxes given in the Hydro Pressurepage.
The Hydro Pressure page contains multiple fields such as Report Number, Inspection Date, Location, Result, Signature, Attach, Print, and Sync. (See the topic “The MIR page contains the following fields“ for more details about each field in the Hydro Pressure page.)
To add your hydro pressure inspection result
1. Once you find out the report where you need to add your inspection details, tap  (Result icon) to add your inspection results, See Fig 12.1.
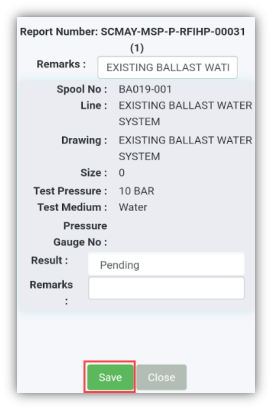
The Result page opens with a list of reports with the material details. Each report shows material specifications such as spool number, line number, drawing number, size, test pressure and medium, and pressure gauge number.
2. In the Remarksbox, type your remarks if any.
3. In the Resultbox, tap and choose Pending, Accepted, Rejected or Cancelled from a drop-down list based on your inspection details.
4. In the Remarksbox, type your remarks if any.
5. Tap Save.
To add your signature
Once you have saved your inspection results, the Result page automatically redirects you into the Signature page. Otherwise, tap
 (Signature icon), See Fig 10.1.
To know how to add your signature, see the topic “To add your signature“.
NDT REPORTS
12.0 NDT REPORTS
The NDT REPORTS tab allows you to check and update the NDT request raised in the web application, by adding and updating your inspection details. This feature automatically updates and synchronizes your inspection details with the NDT report that is uploaded in the web application.
There are four main types of NDT Reports: RT, UT, DPT, and MPT.
 Note: when you click the NDT REPORTS tab in the dashboard, the NDT Reports page displays a list of reports corresponding to today and previous day. However, if you want to view the reports for other dates, you must navigate to the TAKE OFFLINE DATA option. (See " TAKE OFFLINE DATA" for more details.)
1. Tap NDT REPORTS.See Fig 2.3.
The NDT Reports page opens with a list of reports for the corresponding types such as RT, UT, DPT, and MPT. You must select the respective type to view the relevant reports.
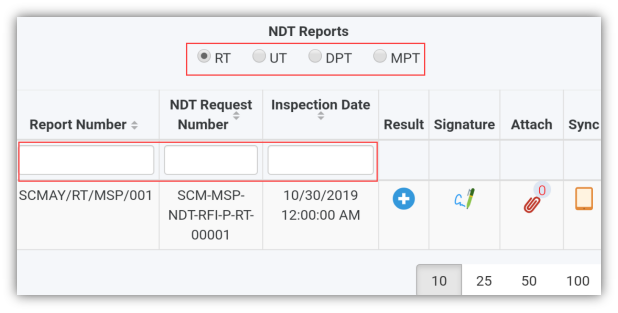
Figure 13.1 NDT Reports page
 Tip: I. You can configure displaying of the number of reports per page by selecting 10, 25, 50 or 100, accordingly.
- If you want to filter one report among the list of reports, you must enter the report number, NDT request number or inspection date details in the respective boxes given in the NDT Reportspage.
The NDT Reports page contains multiple fields such as Report Number, NDT Request number, Inspection Date, Result, Signature, Attach, and Sync. (See the topic “The MIR page contains the following fields“ for more details about each field in the NDT Reports page.)
 Tip: In the NDT Reports option, the Print field is not available.
To add your inspection result for NDT RT report
- Tap RT.
- Once you find out the NDT RT report where you need to add your inspection details, tap
 (Result icon) to add your inspection results, See Fig 13.1.

The Result page opens with a list of reports with the material details.
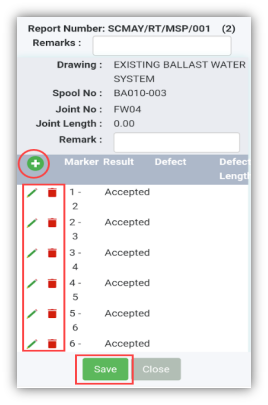
Each report shows material specifications such as drawing number, spool number, joint number, and joint length.
3. In the Remarksbox, type your remarks if any.
4. If you want to add the new NDT RT report, tap  (Add icon). A new window opens.
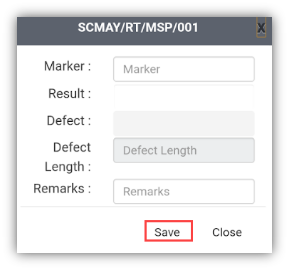
- In the Marker box, enter the marker number.
- In the Resultbox, tap and choose NA, Accepted, Rejected or Reshoot from a drop-down list based on your inspection details.
- In the Remarksbox, type your remarks if any.
- Tap Save.
5. If you want to edit the existing NDT RT report, tap  (Edit icon). A new window opens.
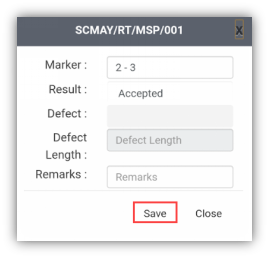
- In the Marker box, check and edit the marker number if you want.
- In the Resultbox, tap and choose NA, Accepted, Rejected or Reshoot from a drop-down list based on your inspection details.
- In the Remarksbox, type your remarks if any.
- Tap Save.
6. If you want to delete any existing NDT RT report from a list, tap  (Delete icon).
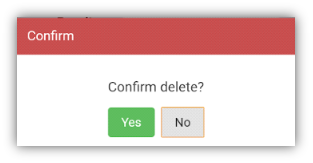
You will receive the following notification: “Confirm delete?”. If you want to delete tab Yes, otherwise tab No.
- Tap Save.
To add your signature for NDT RT Report
Once you have saved your inspection results, the Result page automatically redirects you into the Signature page. Otherwise, tap
 (Signature icon), See Fig 10.1.
To know how to add your signature, see the topic “To add your signature“.
To add your inspection result for NDT UT, DPT, and MPT reports
 Note: Follow the same procedure to add result for the NDT UT, DPT or MPT reports.
- Tap UT,DPT or MPT, See Fig 13.1.
- Once you find out the NDT UT, DPT or MPT report, where you need to add your inspection details, tap
 (Result icon) to add your inspection results, See Fig 13.1.

The Result page opens with a list of reports with the material details.
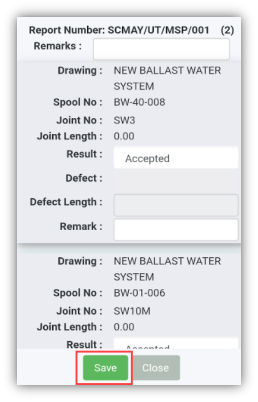
Each report shows material specifications such as drawing number, spool number, joint number, and joint length.
- In the Remarksbox, type your remarks if any.
- In the Resultbox, tab and choose Accepted, Rejected or Cancelled from a drop-down list based on your inspection details.
- In the Remarksbox, type your remarks if any.
- Tap Save.
To add your signature for NDT UT, DPT, and MPT reports
Once you have saved your inspection results, the Result page automatically redirects you into the Signature page. Otherwise, tap
 (Signature icon), See Fig 10.1.
To know how to add your signature, see the topic “To add your signature“.